


Subsurface Barrier Layer
Porosity (BLP)
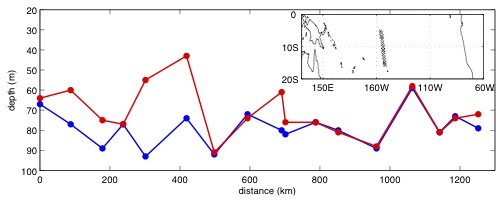
Top of Thermocline Depths (TTD_DTm02, blue) and Isopycnal Layer Depths (MLD_DReqDTm02, red) measured in the central Pacific from 5°S to 15°S along approximately 155°W during the science program of voyage S216 on SSV Robert C. Seamans of the Sea Education Association (map in the top right corner, the crosses indicate the stations, the voyage was undertaken southward). The measurements took place between 17 and 26 April 2008. Stations where the pycnocline is shallower than the thermocline are stations where a barrier layer was detected. This transects shows an example of the "patchiness" of BLT on timescales of 10 days and a few 100 km.
The surface mixed layer, as a fluid surface boundary layer, is a permanent feature of the ocean surface layer. On the contrary Barrier Layers (BL) are not necessarily present in the subsurface layer of the ocean. This observed patchiness (see figure on the right) has the potential to modify the importance of the BL on air-sea heat exchange, since the BL can only effectively obstruct the heat transfer if it is sufficiently persistent or if it is continuous over a sufficiently large area. If the barrier layer is dotted with "holes", in other words if it is relatively "porous", its role as an inhibitor of heat transfer can be greatly reduced, to the extent that the area available in the "holes" may allow turbulence and entrainment to act in the normal way.
BLs can appear or disappear according to the space and time scales of their formation and destruction mechanisms. BLs distribution at a specific grid point is thus not necessarily Gaussian but rather skewed toward high values. As a result, the classic approach for estimating BLT on a 2°Ă—2°-monthly grid (see BLT section) possibly underestimates the thickness of the BL when it really occurs. Hereunder, we give two alternative variables that both characterizes what could be called the "really occuring" Barrier Layer Thickness: the revisited-BLT and the Barrier Layer Porosity (BLP).
NB: No smoothing or statistical interpolation were applied to those fields.
1. revisited-BLT
We estimate the revisited-BLT or "really-occuring"-BLT from both temperature and density profiles and for each given spatio-temporal grid box. In each meshbox, the revisited - BLT is the median of all classic BLT (with DT02 criterion here) that do exhibit a significant BLT. The selection criteria for each station to have such a significant BLT is given below :
|
revisited-BLT(x,y,t) = median[all significant-BLT in (x,y,t) meshbox]
where a significant-BLT is equivalent to the 2 following conditions : (1) BLT > 5 m (2) BLT > 0.1Ă—TTD |
A significant-BLT is large enough in absolute value (over 5m) and in relative value (more than 10% of the warm surface layer in which it is embedded). Note that this approach to estimate BLT is a modification of the classical approach. We call this new estimation of the "really occuring" BLT the revisited-BLT that will be by construction always greater or equal to the classic BLT.
DATA| 1.1. Global Scale, Annual Climatology (12 month) |
| Space/Time Resolution | Basic T/S Profiles Used | Data File | Plots | Reference(s) |
|---|---|---|---|---|
|
≃ 175,000 temperature/density profiles More info...
|
revisited-blt_blp_DTm02_c1m_reg2.0_Global.nc [3.9 Mo] (updated Apr. 2009, same dataset as below for BLP) |
|
Mignot et al. 2009 [6] |
2. BLP
We estimate the Barrier Layer Porosity (BLP) from both temperature and density profiles and for each given spatio-temporal grid box. We calculate the ratio R of the number of stations where a significant-BLT (cf. section above) exists to the total number of stations in the grid box. This ratio can be considered as a measure of BL persistence. We define the BLP as the quantity 1-R, expressed in % :
|
BLP(x,y,t) = 100
Ă— (1-R) = percentage of not
significant-BLT in (x,y,t) meshbox
with: R = Nstations[with significant-BLT in (x,y,t) meshbox] / Nstations[total in (x,y,t) meshbox] |
Our goal is to estimate the robustness of the measured BLT on a global scale regarding our time/space resolution. The greater the BL Porosity, the more uneven the distribution of the BLT with respect to the space/time scale considered and the greater the transmissivity of the region (the smaller the isolating effect of the Barrier Layer). By using the term "porosity", we deliberately propose an analogy with the situation in porous rocks where water can pass through the crevices and other openings but not through the rock itself. Note that this concept of BL porosity is close to the concept of sea ice concentration that defines, for a given grid point, the percentage of area covered by sea ice. For example, if a mesh box has a BLP = 70% and revisited-BLT = 30m, it means that about 70% of the mesh box has a non significant BLT, and only 30% of it has a BLT of median value = 30m. That BLT, despite being thick (even for the classic BLT that may be about 10m), has probably a low impact on air-sea interaction in the area (see Mignot et al., 2009 [6] for further discussions and details).
DATA| 2.1. Global Scale, Annual Climatology (12 month) |
| Space/Time Resolution | Basic T/S Profiles Used | Data File | Plots | Reference(s) |
|---|---|---|---|---|
|
≃ 780,000 temperature/density profiles More info...
|
revisited-blt_blp_DTm02_c1m_reg2.0_Global.nc [3.9 Mo] (updated Apr. 2009, same dataset as above for revisited-BLT) |
|
Mignot et al. 2009 [6] |