


Data Description
General Description of Methodology and Data
We present below a general description of the data and of the methodology used to construct them (for the L2 and L3 data types we produce). In this work, we basically compute advanced ocean variables (e.g. Mixed Layer Depth...) from T/S ocean profiles and from that we construct maps, climatologies or indexes at different space/time resolutions. In the whole process, we can see 3 levels of datasets (cf scroll down menu from Data Access section on the left) :
Further details about each level of data treatment are given hereunder. You can also find more specific information about each dataset in the Data Access sections.
LEVEL 1: Profile Data
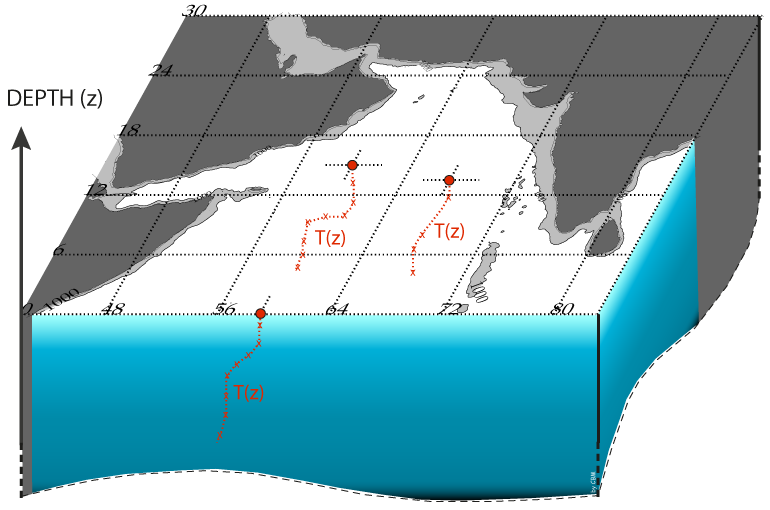
Schematic of Level 1 Profile Data: these data are the profiles of the basic ocean variables that we can measure (e.g. in situ temperature, conductivity...) at sea. They encompass several values for each measurement level and for a given location and date. For a profile variable measured called V, it has the form: V(x,y,z,t), with x, y, z, and t taking dicrete values.
These are the basic in situ observations from which we perform our work. For now the two variables we use are the Temperature and Salinity. It is important to note that salinity is not measured directly but computed from conductivity, pressure and temperature (directly measured). As such we can see that we have several sub levels of treatment inside this level 1 data before getting the final data of common variables such as salinity (idem for oxygen).
We are little involved in all the Level 1 processes,
including computing variables such as salinity or oxygen and
also qualifying them. For this job, we rely on oceanographic
data centers and programs.
Those basic observation data of ocean T/S profiles are
mainly obtained from the National Oceanographic Data Center
through World Ocean Database
(WOD),
and World Ocean Circulation Experiment
(WOCE)
database, and from
the ARGO program.
Those are all the relatively high vertical
resolution data available since the 1940's until nowdays
(e.g. MBT, XBT, CTD and PFL).
The "L1 Profile Data" section simply gives you some links from where you could get those basic T/S profiles data if ever you want to use them as we do.
LEVEL 2: Pointwise Data
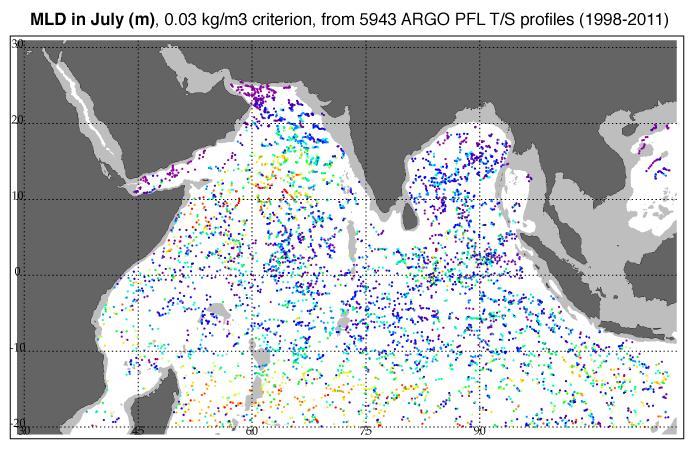
An exemple of a figure from Level 2 Pointwise Data. Here it represent all the Mixed Layer Depth computed from the ARGO floats between 1998 and 2011. For the colorbar, refer to the one in the figure of Level 3 data below.
Our work consist in producing those L2 and L3 data based on a common IDL tool called GAIO (Generator of Atlas from In situ Observations). It has been initially developped for computing a Mixed Layer Depth Climatology (de Boyer Montégut et al., JGR , 2004 [1]) and encompasses about 60 routines and 20,000 lines of code.
Oceanic variables are estimated directly from individual instantaneous profiles with data at observed levels. Basic quality controls are done added to the different quality flags used from the original datasets of profiles and according to the variable we compute. This kind of data actually represent the main preliminary step in generating gridded fields, and may encompass some information that binned and interpolated gridded fields cannot have. Some of those advanced ocean variables computed from individual profiles are made available on the "L2 Pointwise data" section.
LEVEL 3: Gridded Data
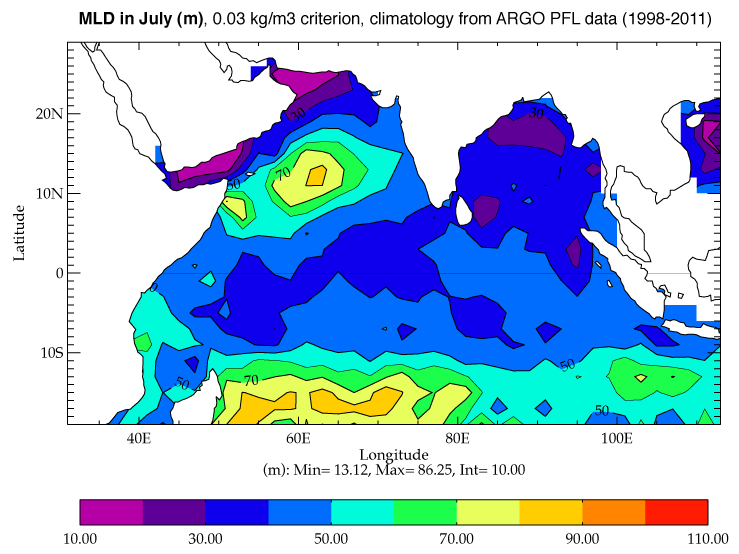
Example of the Level 3 Gridded Data obtained after binning and statistical interpolation of L2 data shown on the figure above.
Gridded fields of the L2 computed variables are obtained by reduction/binning of the data on the chosen grid, using the median of all values in each grid mesh. A slight smoothing might then be applied to take account of the noisy nature of ship observations.
Statistical interpolation is eventually used to predict the field values at missing data places. Ordinary Kriging was used for this last step. This interpolation is limited regionally according to the correlation scales of the oceanic variable and the number of basic values in that area, leaving regions without values instead of filled by a doubtful interpolation. It is important to note that kriging may be used as an exact interpolator.
The "L3 Gridded data" section gives you acces to each climatology data available so far, along with some basic analysis plots and the references for details of their construction.